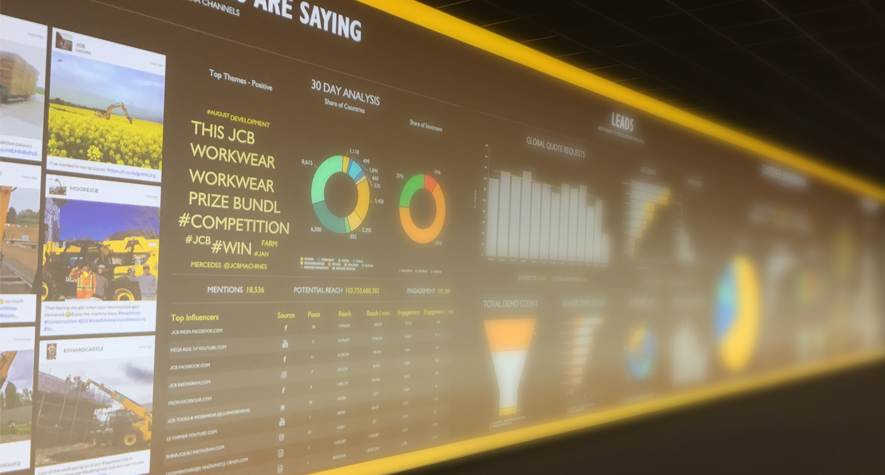
Digital signage has become an increasingly popular form of advertising and communication for businesses of all sizes. With the ability to display dynamic and engaging content, it’s no wonder that more and more companies are incorporating digital signage into their marketing strategies. However, in order to truly maximize the impact of your digital signage, it’s important to track and analyze its performance. In this article, we’ll discuss the importance of analytics and reporting for digital signage and how it can help improve your overall marketing strategy.
Why Analytics and Reporting Matter

Analytics and reporting are crucial for any marketing strategy, and digital signage is no exception. By tracking and analyzing the performance of your digital signage, you can gain valuable insights into its effectiveness and make data-driven decisions for future campaigns. This not only helps you understand your audience better, but it also allows you to optimize your content and placement for maximum impact.
Proof of Play
Proof of play analytics is a crucial aspect of digital signage analytics and reporting. It refers to the tracking and analysis of when and how content is played on digital signage displays. By utilizing proof of play analytics, businesses can gain valuable insights into how their content is being consumed and its effectiveness in engaging the target audience.
To implement proof of play analytics, digital signage systems often utilize sensors or software that can detect when content is being displayed on a screen. This data is then collected and analyzed to provide information such as the number of times a particular content was played, the duration of each play, and the location of the display.
The benefits of proof of play analytics include:
- Performance Evaluation: By tracking the number of times content is played, businesses can assess the reach and exposure of their digital signage campaigns. This data can help evaluate the effectiveness of different messages or content formats.
- Audience Engagement: Analyzing the duration of play can provide insights into audience engagement. For example, if certain content receives longer playtimes, it indicates that the audience finds it more interesting or engaging.
- Ad Revenue Generation: Proof of play analytics can be particularly valuable for digital signage networks that generate revenue through advertising. By providing detailed playtime data, businesses can accurately charge advertisers based on the exposure their ads receive.
- Optimization: By analyzing proof of play data, businesses can identify patterns and trends, allowing them to optimize content placement, scheduling, and overall digital signage strategies. This optimization can lead to better audience targeting and increased engagement.
To implement proof of play analytics, digital signage solutions often provide built-in reporting features or integrate with third-party analytics platforms. This enables businesses to track and analyze the performance of their digital signage campaigns, make data-driven decisions, and continuously refine their strategies for maximum impact.
Performance Tracking

Performance tracking is another important aspect of analytics and reporting for digital signage. By setting specific goals and tracking your progress, you can see how your digital signage is contributing to your overall marketing strategy. For example, if your goal is to increase foot traffic to your store, you can track the number of views and clicks on your digital signage and see if there is a correlation with an increase in foot traffic. This allows you to measure the success of your digital signage and make adjustments as needed.
The Importance of Data Visualization
Data visualization is a key component of analytics and reporting for digital signage. By presenting your data in a visually appealing and easy-to-understand format, you can quickly identify patterns and trends. This can help you make informed decisions and improve the effectiveness of your digital signage. Use tools like charts, graphs, and infographics to present your data in a visually appealing way.
In Conclusion
Analytics and reporting are essential for any successful digital signage campaign. By tracking and analyzing the performance of your digital signage, you can gain valuable insights and make data-driven decisions for future campaigns. Use tools like SEO analytics, digital signage analytics, and performance tracking to optimize your digital signage and improve your overall marketing strategy. With the right data and analysis, you can take your digital signage to the next level and see a significant impact on your business.
